Monitoring and commands
Live values, commands and trend charts of a machine.
The Monitoring tab is the first tab of the machine page.
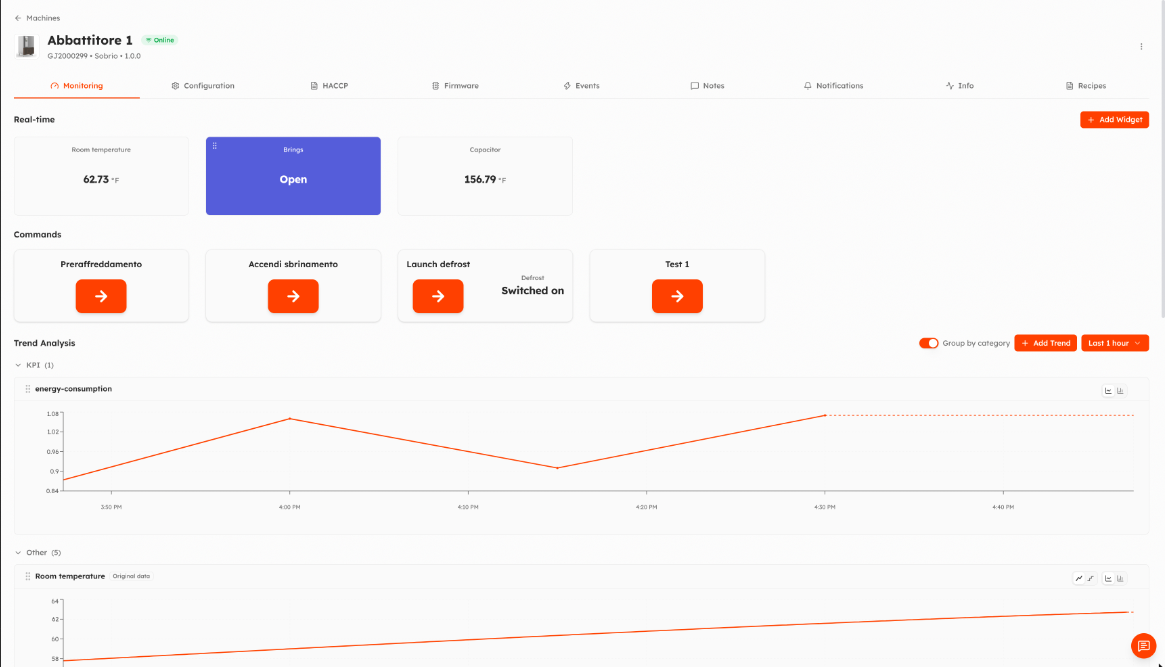
Real-time
Widgets with the latest value of metrics, states and KPIs, updated live while the page is open. While someone is watching, machines that support it send data more often.
- Add Widget: choose a variable (metric, state or KPI) or a static link.
- Each widget can be edited or removed. Reset View restores the default view defined on the firmware (see Commands and monitoring view).
Commands
Shown if you can execute commands. Each command is defined on the firmware and sends a set of parameter values to the machine. If the command allows it, you can change the values before sending them; minimum and maximum are checked. Click the button, confirm, and Things5 shows whether the machine accepted the command.
Trend Analysis
Charts of metrics, states and KPIs over time.
- Choose the period with the time picker: quick ranges (last hour … last 6 months, today, this week…) or a custom range.
- Add Trend: choose variables, interpolation (linear or step) and whether to show gaps in the data. Line or bar chart.
- Drag on the chart to zoom; hover to read values.
- States are shown as a timeline with the time spent in each value.
Widgets and charts are saved per machine. Values are shown in the units chosen in your preferences.
Updated 9 days ago